Aggregate pit and processing yard
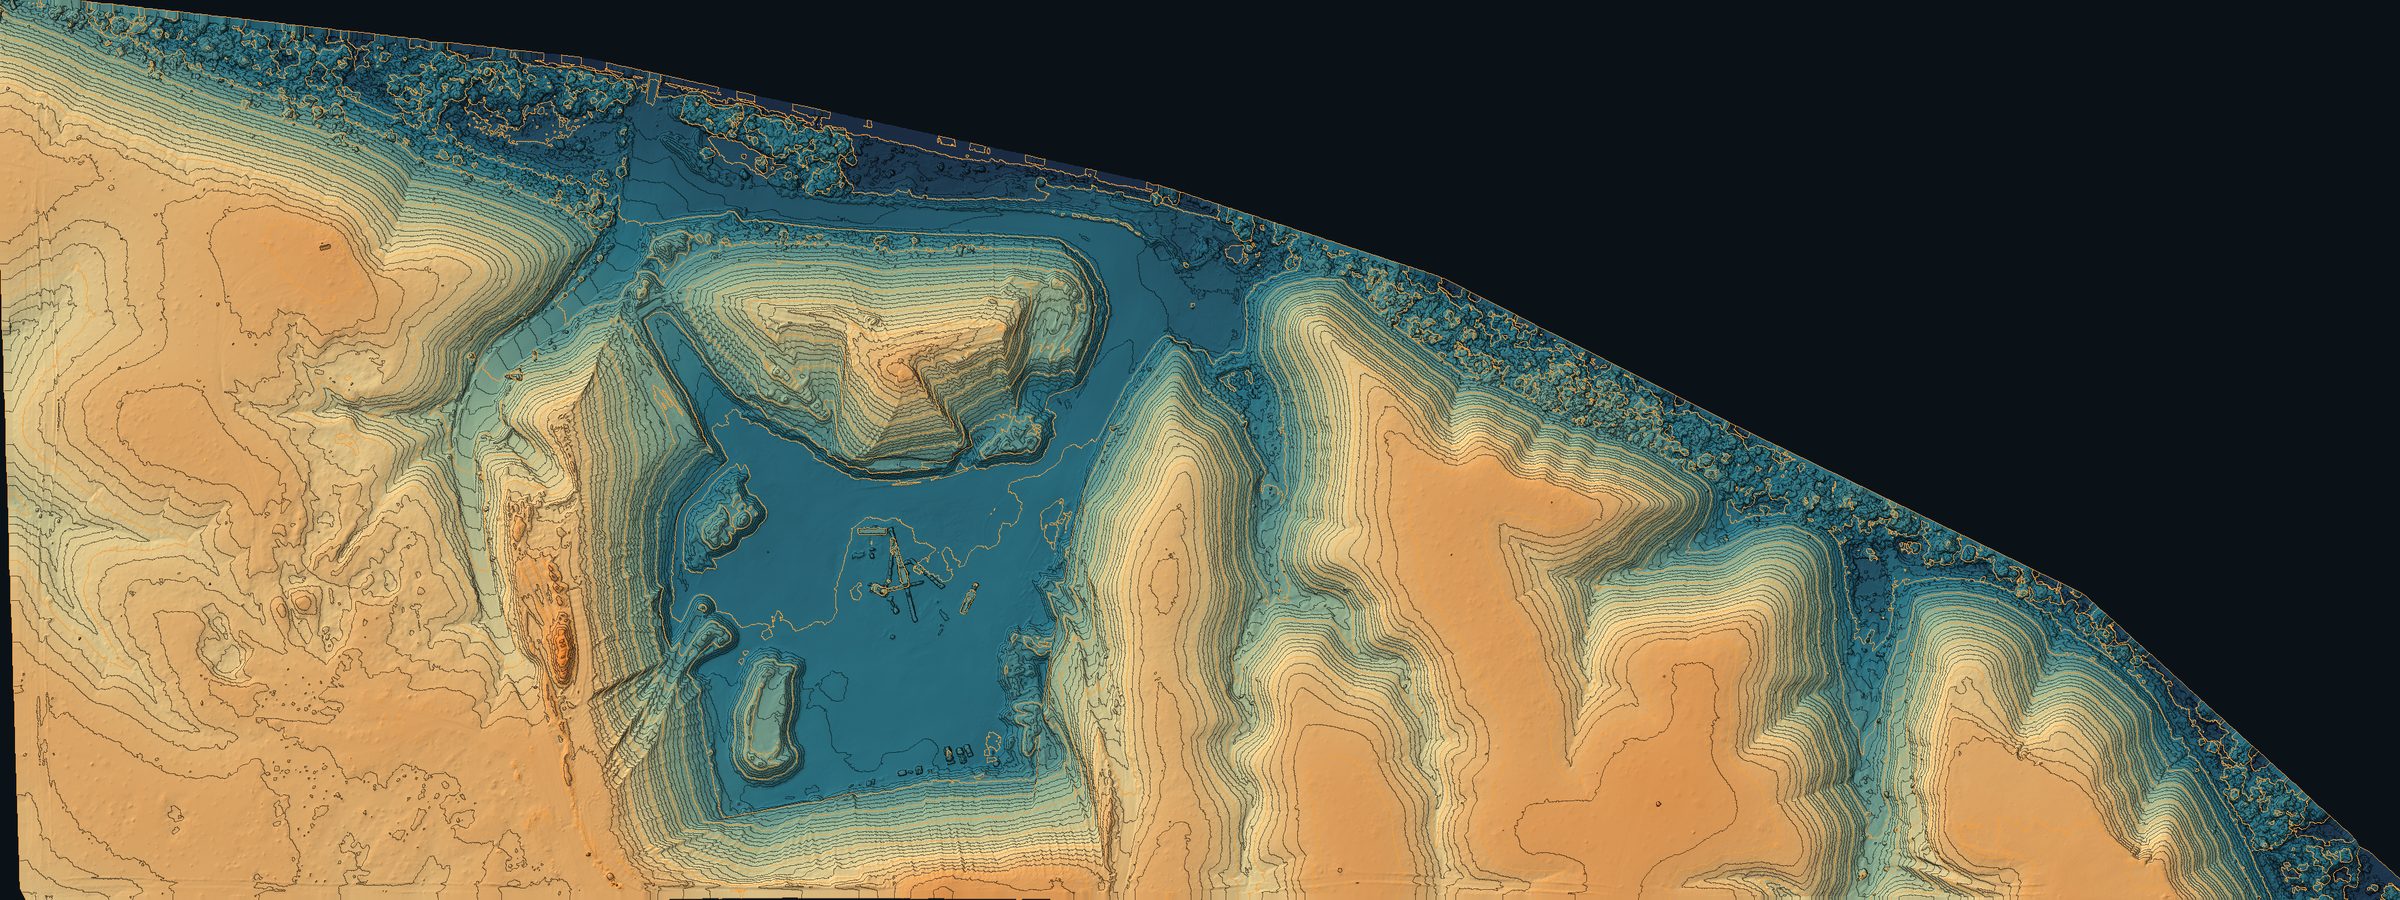
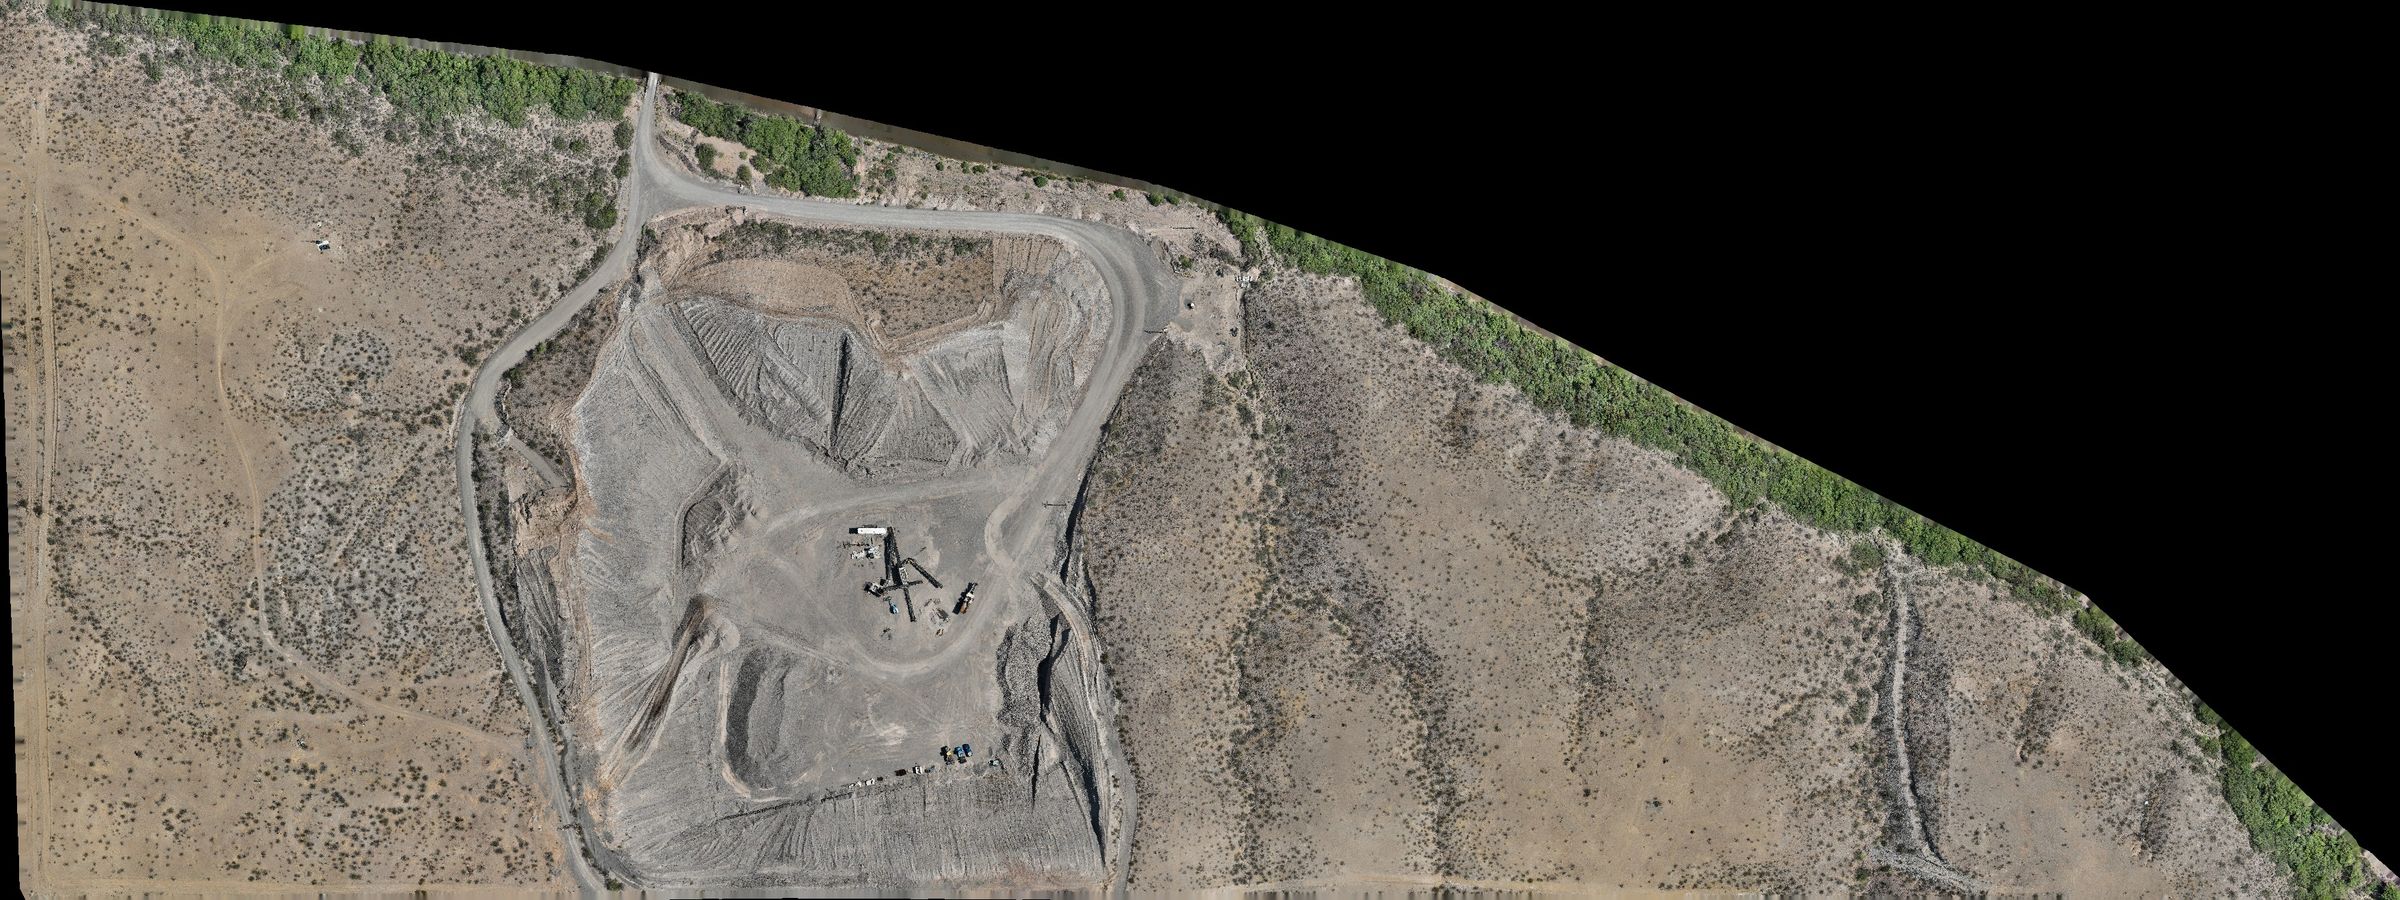
Whole-site model — 71.2 acres in one flight. Drag to spin the model, or switch to the elevation and orthophoto maps and zoom in.
Loading site model
How to use this site model
Three views of the same flight. Nothing to install, and nothing you can break.
- 01
Spin the model
On 3D orbit, drag left or right to walk the camera around the site. Auto-spin turns it slowly on its own; Reset view puts it back where it started.
- 02
Read the ground
Elevation & 2 ft contours colours the surface by height — blue low, orange high — with a contour every 2 ft and a heavier line every 10 ft. Orthophoto is the same ground as a photograph. On both, drag to pan and scroll or pinch to zoom. North is up.
- 03
Measure something
Press Measure — from the orbit view it opens the elevation map for you — then click or tap two points. You get horizontal distance, elevation change, slope distance, grade and slope angle between them. Press Clear to start over. Heights come from the same surface the contours do.
- 04
What the numbers mean
Elevations are relative to the model datum — the low point of the model reads zero — so differences are meaningful even though the absolute values are not tied to a published vertical datum. Distances are ground distances in feet.
- Camera heading
- —
Drag left or right to spin the model